基于MATLAB泄洪激励的可视化模型向原型转化程序 |
||||||
www.liuguohuan.net          科研团队与课题研究招收与招聘
        基于MATLAB的试验模型响原型转化的泄洪可视化程序
   (MATLAB / 2007 )
天津大学 建筑工程学院 ; 天津大学 前沿技术研究院; 国家重点实验室-水利工程仿真与安全
 程序主页面  程序运行结果显示
function varargout = flood_discharge_excitation(varargin)
% FLOOD_DISCHARGE_EXCITATION M-file for flood_discharge_excitation.fig
% FLOOD_DISCHARGE_EXCITATION, by itself, creates a new FLOOD_DISCHARGE_EXCITATION or raises the existing
% singleton*.
%
% H = FLOOD_DISCHARGE_EXCITATION returns the handle to a new FLOOD_DISCHARGE_EXCITATION or the handle to
% the existing singleton*.
%
% FLOOD_DISCHARGE_EXCITATION('CALLBACK',hObject,eventData,handles,...) calls the local
% function named CALLBACK in FLOOD_DISCHARGE_EXCITATION.M with the given input arguments.
%
% FLOOD_DISCHARGE_EXCITATION('Property','Value',...) creates a new FLOOD_DISCHARGE_EXCITATION or raises the
% existing singleton*. Starting from the left, property value pairs are
% applied to the GUI before flood_discharge_excitation_OpeningFunction gets called. An
% unrecognized property name or invalid value makes property application
% stop. All inputs are passed to flood_discharge_excitation_OpeningFcn via varargin.
%
% *See GUI Options on GUIDE's Tools menu. Choose "GUI allows only one
% instance to run (singleton)".
%
% See also: GUIDE, GUIDATA, GUIHANDLES
% Edit the above text to modify the response to help flood_discharge_excitation
% Last Modified by GUIDE v2.5 11-Jan-2013 15:09:55
% Begin initialization code - DO NOT EDIT
gui_Singleton = 1;
gui_State = struct('gui_Name', mfilename, ...
'gui_Singleton', gui_Singleton, ...
'gui_OpeningFcn', @flood_discharge_excitation_OpeningFcn, ...
'gui_OutputFcn', @flood_discharge_excitation_OutputFcn, ...
'gui_LayoutFcn', [] , ...
'gui_Callback', []);
if nargin && ischar(varargin{1})
gui_State.gui_Callback = str2func(varargin{1});
end
if nargout
[varargout{1:nargout}] = gui_mainfcn(gui_State, varargin{:});
else
gui_mainfcn(gui_State, varargin{:});
end
% End initialization code - DO NOT EDIT
% --- Executes just before flood_discharge_excitation is made visible.
function flood_discharge_excitation_OpeningFcn(hObject, eventdata, handles, varargin)
% This function has no output args, see OutputFcn.
% hObject handle to figure
% eventdata reserved - to be defined in a future version of MATLAB
% handles structure with handles and user data (see GUIDATA)
% varargin command line arguments to flood_discharge_excitation (see VARARGIN)
% Choose default command line output for flood_discharge_excitation
handles.output = hObject;
% Update handles structure
guidata(hObject, handles);
% UIWAIT makes flood_discharge_excitation wait for user response (see UIRESUME)
% uiwait(handles.figure1);
% --- Outputs from this function are returned to the command line.
function varargout = flood_discharge_excitation_OutputFcn(hObject, eventdata, handles)
% varargout cell array for returning output args (see VARARGOUT);
% hObject handle to figure
% eventdata reserved - to be defined in a future version of MATLAB
% handles structure with handles and user data (see GUIDATA)
% Get default command line output from handles structure
varargout{1} = handles.output;
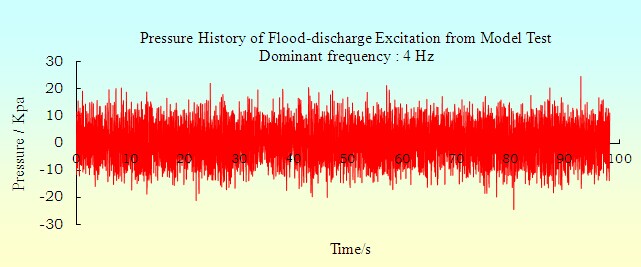
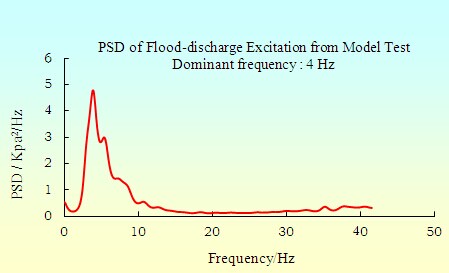
% figure %%% flood_discharge_excitation 模型频谱 界面显示
[X,map]=imread('f:\Program Files\MATLAB71\work\flooddischargeexcitation\Model_Test_10Hz.jpg');
imshow(X,map)
set(gcf,'menu','none','NumberTitle','off','Name','泄洪激励程序 V2013.1版 程序')
%
% figure %%% flood_discharge_excitation 模型时程 界面显示
% [Y,map]=imread('f:\Program Files\MATLAB71\work\flooddischargeexcitation\History.jpg');
% imshow(Y,map)
% set(gcf,'menu','none','NumberTitle','off','Name','泄洪激励程序2 V2013.1版 程序')
figure %%% flood_discharge_excitation 模型频谱 界面显示
[X,map]=imread('f:\Program Files\MATLAB71\work\flooddischargeexcitation\interface.jpg');
imshow(X,map)
set(gcf,'menu','none','NumberTitle','off','Name','泄洪激励程序 V2013.1版 程序')
set(gcf,'Position',[520,250,500,370])
function Geometric_similarity_ratio_Callback(hObject, eventdata, handles)
% hObject handle to Geometric_similarity_ratio (see GCBO)
% eventdata reserved - to be defined in a future version of MATLAB
% handles structure with handles and user data (see GUIDATA)
% Hints: get(hObject,'String') returns contents of Geometric_similarity_ratio as text
% str2double(get(hObject,'String')) returns contents of Geometric_similarity_ratio as a double
% --- Executes during object creation, after setting all properties.
function Geometric_similarity_ratio_CreateFcn(hObject, eventdata, handles)
% hObject handle to Geometric_similarity_ratio (see GCBO)
% eventdata reserved - to be defined in a future version of MATLAB
% handles empty - handles not created until after all CreateFcns called
% Hint: edit controls usually have a white background on Windows.
% See ISPC and COMPUTER.
if ispc && isequal(get(hObject,'BackgroundColor'), get(0,'defaultUicontrolBackgroundColor'))
set(hObject,'BackgroundColor','white');
end
function Modified_dominant_frequency_Callback(hObject, eventdata, handles)
% hObject handle to Modified_dominant_frequency (see GCBO)
% eventdata reserved - to be defined in a future version of MATLAB
% handles structure with handles and user data (see GUIDATA)
% Hints: get(hObject,'String') returns contents of Modified_dominant_frequency as text
% str2double(get(hObject,'String')) returns contents of Modified_dominant_frequency as a double
% --- Executes during object creation, after setting all properties.
function Modified_dominant_frequency_CreateFcn(hObject, eventdata, handles)
% hObject handle to Modified_dominant_frequency (see GCBO)
% eventdata reserved - to be defined in a future version of MATLAB
% handles empty - handles not created until after all CreateFcns called
% Hint: edit controls usually have a white background on Windows.
% See ISPC and COMPUTER.
if ispc && isequal(get(hObject,'BackgroundColor'), get(0,'defaultUicontrolBackgroundColor'))
set(hObject,'BackgroundColor','white');
end
% --- Executes during object creation, after setting all properties.
function text7_CreateFcn(hObject, eventdata, handles)
% hObject handle to text7 (see GCBO)
% eventdata reserved - to be defined in a future version of MATLAB
% handles empty - handles not created until after all CreateFcns called
% --- Executes on button press in Run.
% --- Executes during object creation, after setting all properties.
function Model_dominant_frequency_CreateFcn(hObject, eventdata, handles)
% hObject handle to Model_dominant_frequency (see GCBO)
% eventdata reserved - to be defined in a future version of MATLAB
% handles empty - handles not created until after all CreateFcns called
% Hint: popupmenu controls usually have a white background on Windows.
% See ISPC and COMPUTER.
if ispc && isequal(get(hObject,'BackgroundColor'), get(0,'defaultUicontrolBackgroundColor'))
set(hObject,'BackgroundColor','white');
end
% --- Executes on selection change in Model_dominant_frequency.
function Model_dominant_frequency_Callback(hObject, eventdata, handles)
% hObject handle to Model_dominant_frequency (see GCBO)
% eventdata reserved - to be defined in a future version of MATLAB
% handles structure with handles and user data (see GUIDATA)
% Hints: contents = get(hObject,'String') returns Model_dominant_frequency contents as cell array
% contents{get(hObject,'Value')} returns selected item from
% Model_dominant_frequency
% --- Executes on button press in Run.
function Run_Callback(hObject, eventdata, handles)
% hObject handle to Run (see GCBO)
% eventdata reserved - to be defined in a future version of MATLAB
% handles structure with handles and user data (see GUIDATA)
number=get(handles.Model_dominant_frequency,'Value');
switch number
case 1
Model_dominant_frequency=1.0;
Model_pressuer_history=textread('模型主频1Hz压力时程曲线.txt'); %%% 读取模型主频1.0Hz的压力时程曲线(s,Kpa)
%Model_Power_spectrum_density=textread('模型主频1Hz频谱曲线.txt'); %%% 读取模型主频1.0Hz的功率谱密度((Kpa)^2/Hz)
case 2
Model_dominant_frequency=0.4;
Model_pressuer_history=textread('模型主频0.4Hz压力时程曲线.txt'); %%% 读取模型主频0.4Hz压力时程曲线(s,Kpa)
%Model_Power_spectrum_density=textread('模型主频0.4Hz频谱曲线.txt'); %%% 读取模型主频0.4Hz的功率谱密度((Kpa)^2/Hz)
end
Geometric_similarity_ratio=str2num(get(handles.Geometric_similarity_ratio,'string')); %%% 获取几何相似比
GSR=Geometric_similarity_ratio; %%% 简写
Prototype_dominant_frequency=str2num(get(handles.Modified_dominant_frequency,'string')); %%% 获取原型优势主频 (优势频率)
PDF=Prototype_dominant_frequency; %%% 简写
Model_all_Time=Model_pressuer_history(:,1); %%% 读取模型时间列(s)
Prototype_all_Time=Model_all_Time*(GSR^0.5); %%% 转化为原型(未调节频率)时间列(s)
Prototype_pressuer_history_amplitude=Model_pressuer_history(:,2)*(GSR); %%% 转化为原型(未调节频率)幅值列(Kpa)
Protptype_Pressuer_history=[Prototype_all_Time,Prototype_pressuer_history_amplitude]; %%% 转化为原型(未调节频率)时间-幅值序列(s,Kpa)
Time_modifying=Prototype_all_Time./(PDF/Model_dominant_frequency); %%% 原型变频后时间序列
Protptype_Pressuer_history=[Time_modifying,Prototype_pressuer_history_amplitude]; %%% 原型变频后时间-幅值序列(s,Kpa)
% Prototype_Power_spectrum_density(:,1)=Model_Power_spectrum_density(:,1)/(GSR^0.5)/(PDF/Model_dominant_frequency); %%% 原型变频后频率序列
% Prototype_Power_spectrum_density(:,2)=Model_Power_spectrum_density(:,2)*GSR^2; %%% 原型变频后功率谱-幅值序列(s,Kpa)
figure('Name','Excitation Pressure History of Model','NumberTitle','off')
h1=plot(Model_pressuer_history(:,1),Model_pressuer_history(:,2),'r');
set(gcf,'Position',[5,160,500,270])
set(h1,'LineWidth',1)
xlabel('Time / s')
ylabel('Pressure / KPa');
grid on;
title('Flood Discharge Excitation Pressure Curve of Model ')
dlmwrite('模型洪压-时间历程曲线.xls',[Model_pressuer_history(:,1),Model_pressuer_history(:,2)])
clc
figure('Name','Excitation Pressure History of Prototype','NumberTitle','off')
h2=plot(Time_modifying,Prototype_pressuer_history_amplitude,'r');
set(gcf,'Position',[5,190,500,270])
set(h2,'LineWidth',1)
xlabel('Time / s')
ylabel('Pressure / KPa');
grid on;
title('Flood Discharge Excitation Pressure Curve of Prototype')
dlmwrite('原型洪压-时间历程曲线.xls',[Time_modifying,Prototype_pressuer_history_amplitude])
clc
Lag_M=1000;%延迟样本点数
x_M=Model_pressuer_history(:,2);
[c_M,lags_M]=xcorr(x_M,Lag_M,'unbiased');%对原始信号进行无偏自相关估计
p_M=fft(c_M,length(lags_M));
sf_M=1./(Model_pressuer_history(2,1)-Model_pressuer_history(1,1));
fp_M=(0:1:length(p_M)-1)'*sf_M/length(p_M);
pxmag_M=abs(p_M);
figure('Name','Classic PSD of Model','NumberTitle','off')
set(gcf,'Position',[150,160,500,270])
h3=plot(fp_M(1:length(p_M)/2),pxmag_M(1:length(p_M)/2),'r');
xlabel('Frequency / Hz');ylabel('PSD / KPa^2/Hz');
title('Classic Power Spectrum Density of Model');
grid on;
dlmwrite('模型洪压经典功率谱曲线.xls',[fp_M(1:length(p_M)/2),pxmag_M(1:length(p_M)/2)])
clc
Lag_P=1000;%延迟样本点数
x_P=Prototype_pressuer_history_amplitude;
[c_P,lags_P]=xcorr(x_P,Lag_P,'unbiased');%对原始信号进行无偏自相关估计
p_P=fft(c_P,length(lags_P));
sf_P=1/(Time_modifying(2)-Time_modifying(1));
fp_P=(0:1:length(p_P)-1)'*sf_P/length(p_P);
pxmag_P=abs(p_P);
figure('Name','Classic PSD of Prototype','NumberTitle','off')
set(gcf,'Position',[150,190,500,270])
h4=plot(fp_P(1:length(p_P)/2),pxmag_P(1:length(p_P)/2),'r');
xlabel('Frequency / Hz');ylabel('PSD / KPa^2/Hz');
title('Classic Power Spectrum Density of Prototype');
grid on;
dlmwrite('原型洪压经典功率谱曲线.xls',[fp_P(1:length(p_P)/2),pxmag_P(1:length(p_P)/2)])
clc
figure('Name','Modern PSD of Model','NumberTitle','off')
x_M=Model_pressuer_history(:,2);
sf_M=1./(Model_pressuer_history(2,1)-Model_pressuer_history(1,1));
[psd2,f2,p2_M]=myBurg(x_M,200,'AIC');
nfft_M=length(x_M);%输出数据的长度
[pp,F]=pmem(x_M,p2_M,nfft_M,sf_M);
Model_Power_spectrum_density(:,1)=pp;
Model_Power_spectrum_density(:,2)=F;
h5=plot(Model_Power_spectrum_density(:,2),Model_Power_spectrum_density(:,1),'r');
set(gcf,'Position',[300,160,500,270])
set(h5,'LineWidth',2)
if Model_dominant_frequency==1.0
X_limit_modern=45;
Y_limit_modern=400;
elseif Model_dominant_frequency==0.4
X_limit_modern=45;
Y_limit_modern=700;
end
axis([0 X_limit_modern 0 Y_limit_modern])
xlabel('Frequency / Hz')
ylabel('PSD / (Kpa)^2/Hz');
grid on;
title('Modern Power spectrum Density of model')
dlmwrite('模型洪压现代功率谱曲线.xls',[Model_Power_spectrum_density(:,1),Model_Power_spectrum_density(:,2)])
clc
figure('Name','Modern PSD of Prototype','NumberTitle','off')
x_P=Prototype_pressuer_history_amplitude;
sf_P=1./(Time_modifying(2)-Time_modifying(1));
[psd2,f2,p2_P]=myBurg(x_P,200,'AIC');
nfft_P=length(x_P);%输出数据的长度
[pp,F]=pmem(x_P,p2_P,nfft_P,sf_P);
Prototype_Power_spectrum_density(:,1)=pp;
Prototype_Power_spectrum_density(:,2)=F;
h6=plot(Prototype_Power_spectrum_density(:,2),Prototype_Power_spectrum_density(:,1),'r');
set(gcf,'Position',[300,190,500,270])
set(h6,'LineWidth',2)
if Model_dominant_frequency==1.0
% X_limit_modern=5;
Y_limit_modern=2.5E6;
elseif Model_dominant_frequency==0.4
% X_limit_modern=5;
Y_limit_modern=5.0E6;
end
axis([0 X_limit_modern 0 Y_limit_modern])
xlabel('Frequency / Hz')
ylabel('PSD / (Kpa)^2/Hz');
grid on;
title('Modern Power spectrum Density of Prototype')
dlmwrite('原型洪压现代功率谱曲线.xls',[Prototype_Power_spectrum_density(:,1),Prototype_Power_spectrum_density(:,2)])
clc
  下载链接:
本程序免费下载 / 欢迎提出宝贵意见 / 敬请尊重劳动成果
|
||||||
当前位置:首页 > 程序开发 / Fortran C# VC MATLAB >


